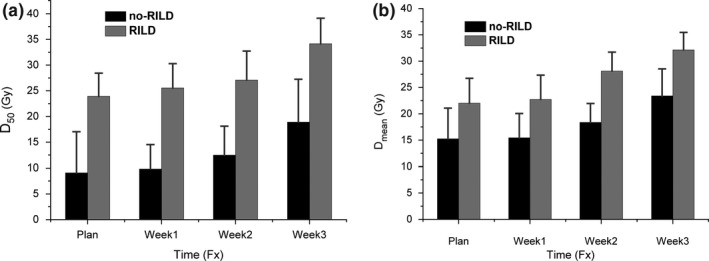
Figure 8.

The reconstructed weekly (a) D50 and (b) Dmean, relative to planned D50 and Dmean. Error bars indicate standard deviation. Herein, no‐RILD represents patients who did not develop RILD post‐RT, and RILD represent patients were diagnosed of RILD post‐RT.
