Figure 2.

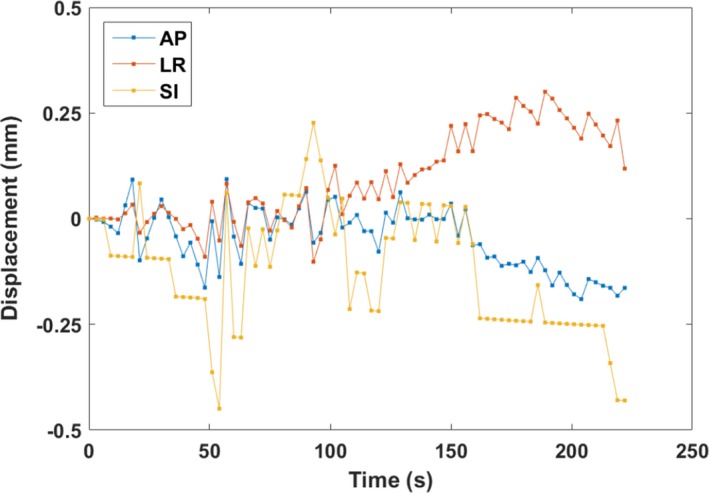
The most stable prostate trajectory recorded during the study. Motion in the AP, LR, and SI directions is plotted as a function of time.

The most stable prostate trajectory recorded during the study. Motion in the AP, LR, and SI directions is plotted as a function of time.