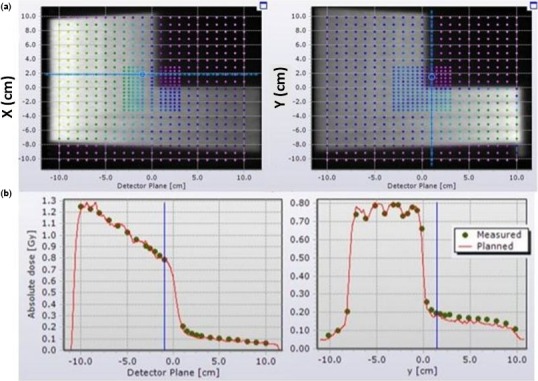
Figure 3.

Beam profiles along the two detector plan in Delta4 of field “FourL” measured in a 6 MV photon beam. (a) The brightness level of the grayscale image indicates the planned dose distribution while the overlayed points show the dose measurements. (b) Inline and crossline profile of the measured and planned dose distribution.
