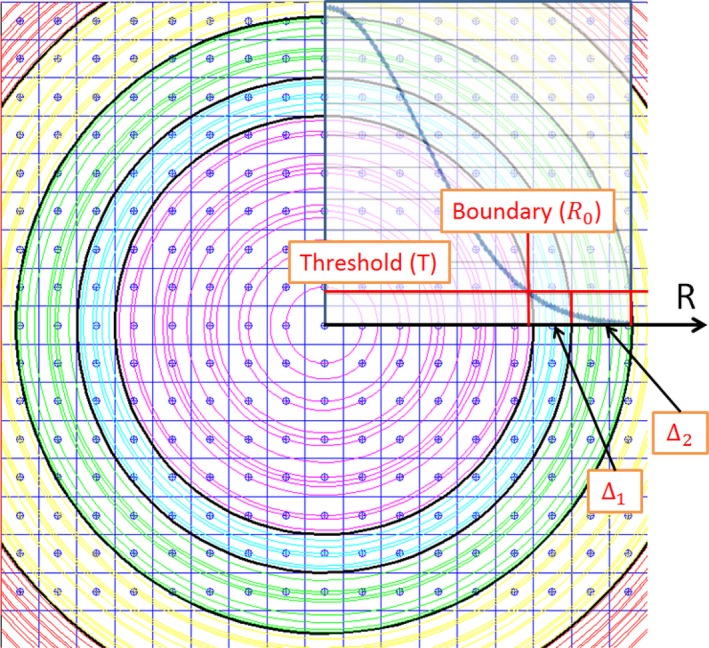
Figure 3.

Lateral dose decreases gradually with increasing radius. The boundary (R 0) is the first point at the radius axis whose corresponding point average dose is either equal to or less than the value of threshold (T). Point average was performed in the high‐dose region (r < R 0). Interval average was performed in the low‐dose region (r ≥ R 0). Δ1 represented by cyan ring is the first radius interval and Δ2 represented by a green ring is the second radius interval.
