
Figure 4.
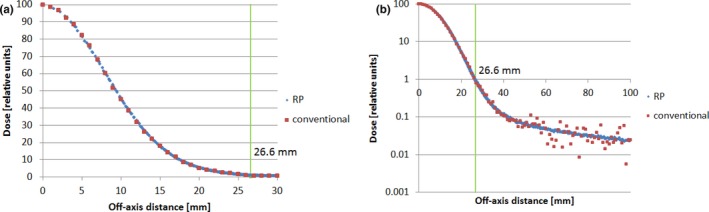
Lateral in‐air dose profiles of proton beam 144.8 MeV at the Isocenter with 2 × 10⁷ proton histories (a) in linear scale and (b) in semi‐log scale. The green vertical lines represent the boundary at the radius of 26.6 mm (radial projection method, blue; conventional method, red). A range shifter of 4.5 g/cm2 was placed 42.5 cm upstream from the isocenter.