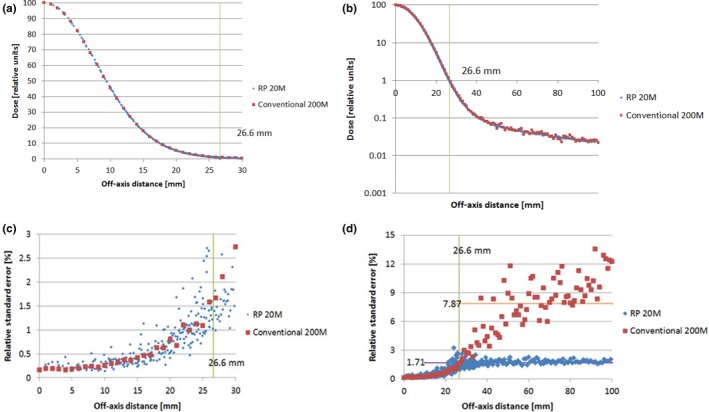
Figure 6.

Upper panels (a) and (b) show the in‐air lateral profiles generated by the radial projection (RP) method (20 million protons, blue) and the conventional method (200 million protons, red): (a) linear scale; (b) semi‐log scale. Corresponding relative standard errors (RSE) are shown in the lower panels, with off‐axis distance up to 30 mm (c) and up to 100 mm (d). The energy of the proton pencil beam was 144.8 MeV. A range shifter of 4.5 g/cm2 was placed 42.5 cm upstream from the isocenter. The raw data from the Monte Carlo simulation were taken at the isocenter plane (RP method, blue; conventional method, red).
