Figure 1.

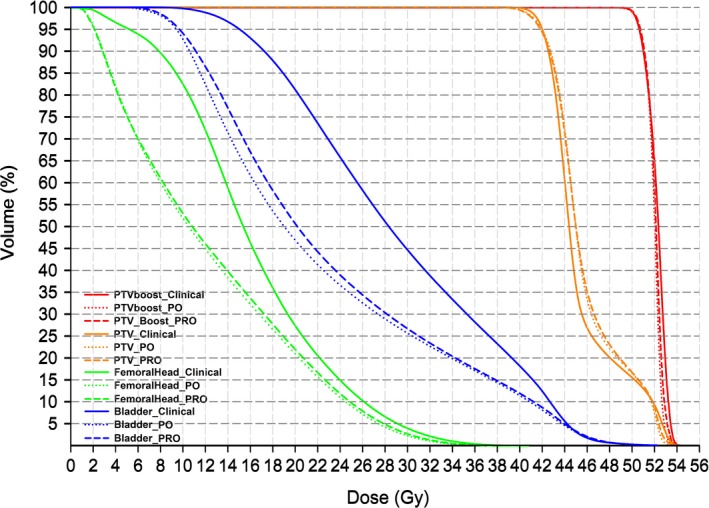
The mean DVHs of 30 patients: the solid, dotted, and dashed lines indicate the clinical, PO and PRO plans, respectively.

The mean DVHs of 30 patients: the solid, dotted, and dashed lines indicate the clinical, PO and PRO plans, respectively.