. 2017 Jan 24;18(2):176–180. doi: 10.1002/acm2.12042
© 2017 The Authors. Journal of Applied Clinical Medical Physics published by Wiley Periodicals, Inc. on behalf of American Association of Physicists in Medicine.
This is an open access article under the terms of the Creative Commons Attribution License, which permits use, distribution and reproduction in any medium, provided the original work is properly cited.
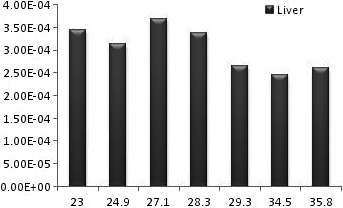
Figure 3.

The diagram of liver equivalent dose for different male BMIs.
