
Figure 3.
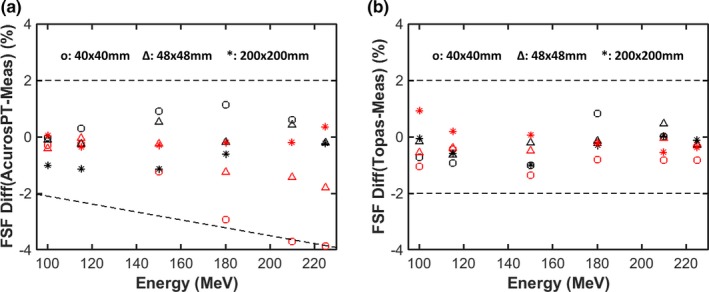
Percentage differences between the calculated and measured field size factors (FSF) for three field sizes at two depths as a function of proton energy for AcurosPT (a) and TOPAS (b). The black markers represent the results at surface while the red markers represent depths close to the Bragg peak. The dashed lines are used for visual guidance of large FSF disagreements.