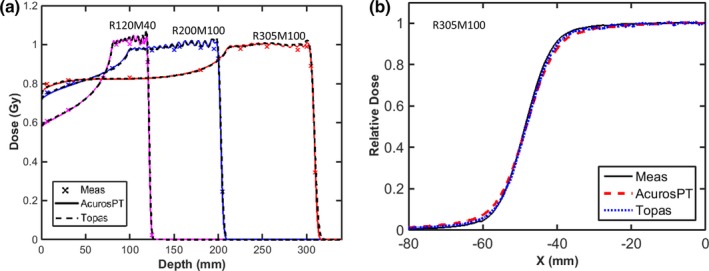
Figure 4.

(a): The central axis depth doses calculated by AcurosPT (solid line) and TOPAS (dashed line) are compared with measurements (cross‐marker) for three proton beams of different proton ranges and modulation width of 100 or 40 mm with field size of 96 mm. Depth dose curve of R120M40 was renormalized by multiplying 105% to avoid overlap with R200M100. (b): The lateral dose profile at mid‐range depth of the R305M100 beam.
