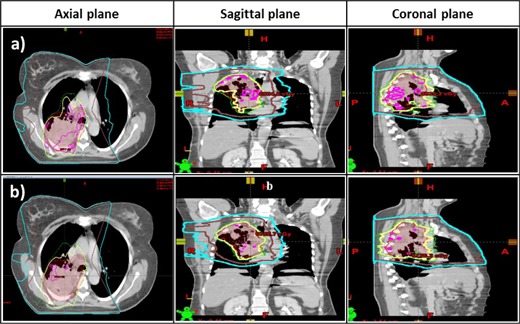
Figure 2.

Final dose distribution for a free‐breathing IMRT plan (Patient #1) for a lung tumor superimposed on CT images in the axial, sagittal, and coronal plane for (a) the original plan without the intermediate dose calculation module, and for (b) the new plan with the intermediate dose calculation module. Isodose lines for 105% (purple), 100% (yellow), and 95% (green) of the prescription dose and 10 Gy (brown), and 5 Gy (cyan) are shown. Note the increased homogeneity in the target, which corresponds to a decrease in hot spots in the new plan.
