
Figure 3.
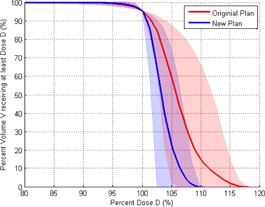
The average PTV DVH between the original (red) and new (blue) plans. The shaded area for both DVHs represents the range of all 11 plans. The PTV DVH for the new plan displays improved dose homogeneity and reduction in hot spots.
Official websites use .gov
A
.gov website belongs to an official
government organization in the United States.
Secure .gov websites use HTTPS
A lock (
) or https:// means you've safely
connected to the .gov website. Share sensitive
information only on official, secure websites.
The average PTV DVH between the original (red) and new (blue) plans. The shaded area for both DVHs represents the range of all 11 plans. The PTV DVH for the new plan displays improved dose homogeneity and reduction in hot spots.