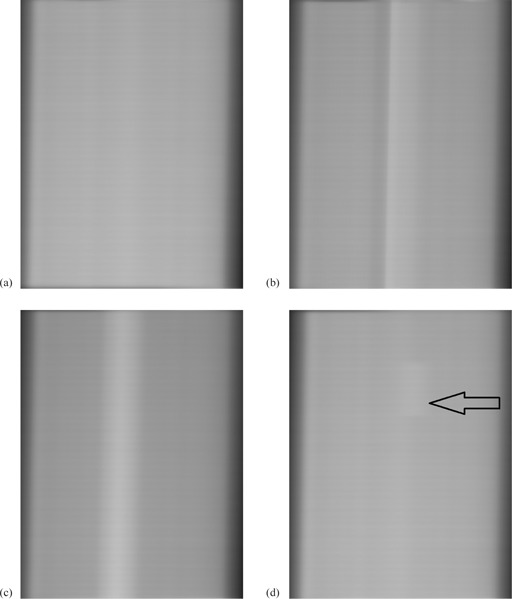
Figure 4.

Typical integrated images: (a) delivery without error, (b) 9° gantry position error at one control point, (c) 20 MU dose error at one control point, and (d) 2 mm position error in eight MLC leaves at one control point (arrowed). All images are normalized to an open‐field image and the errors are at gantry angle 90°.
