Figure 7.

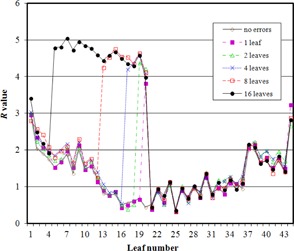
The R‐value for each of the 44 leaves visible in one image, with MLC errors of 2 mm at one control point introduced into various numbers of leaves.

The R‐value for each of the 44 leaves visible in one image, with MLC errors of 2 mm at one control point introduced into various numbers of leaves.