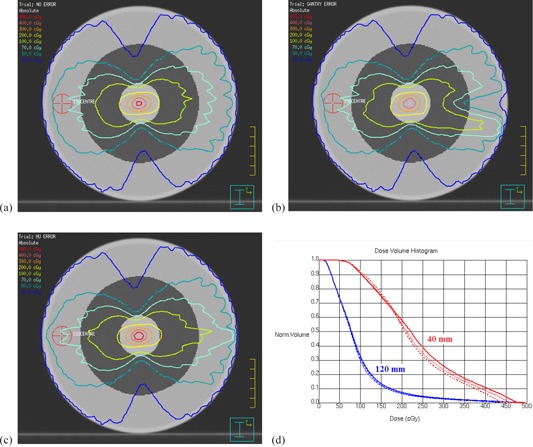
Figure 8.

Potential clinical impact of delivery errors: (a) dose distribution without error, (b) dose distribution for a 9° gantry angle error at 90°, (c) dose distribution for a 20 MU dose error at 90°, (d) dose‐volume histograms for the central 40 mm and 120 mm of the cylindrical phantom without error (thin solid lines), with a 9° gantry angle error at 90° (thick dotted lines), and a 20 MU dose error at 90° (thick solid lines). The phantom is homogeneous, and the central 40 mm and 120 mm are shown in grayscale in (a) to (c).
