Figure 4.

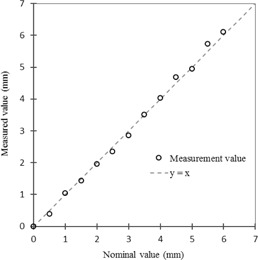
Relationship between values measured by BreathingData based on MR images (y‐axis) and nominal test tube position (x‐axis).

Relationship between values measured by BreathingData based on MR images (y‐axis) and nominal test tube position (x‐axis).