
Figure 10.
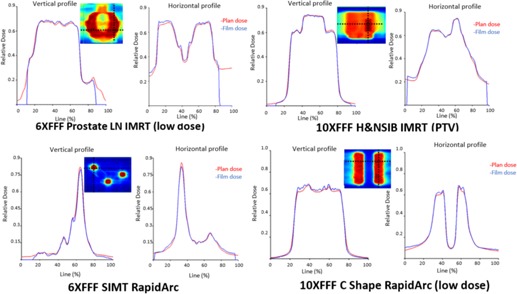
Gafchromic film measurement results for the vertical and horizontal profile comparing the planned versus measured dose in the high‐dose and low‐dose region for both IMRT and RapidArc plans. The red line indicates planned dose, whereas the blue line indicates the measured dose profile. The x‐axis represents the relative position of the selected profile and the y‐axis presents the relative dose.