
Figure 3.
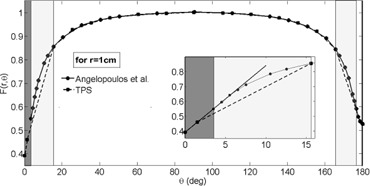
Comparative graph for F(1 cm,θ) between the TPS VID and Angelopoulos et al. (10) publication data. In the dark zone, we can see the zone with a more than 2% difference. The darker zone highlights the extrapolated data. The box shows an amplified zone in which the lineal fit agreement with the VID extrapolated data can be observed.