
Figure 10.
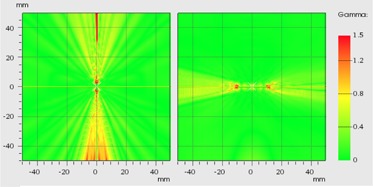
Gamma distribution (). On the left image, the coronal plane of one dwell setup. On the right, sagittal plane centered on one ovoid of the Fletcher setup.
Official websites use .gov
A
.gov website belongs to an official
government organization in the United States.
Secure .gov websites use HTTPS
A lock (
) or https:// means you've safely
connected to the .gov website. Share sensitive
information only on official, secure websites.
Gamma distribution (). On the left image, the coronal plane of one dwell setup. On the right, sagittal plane centered on one ovoid of the Fletcher setup.