
Figure 5.
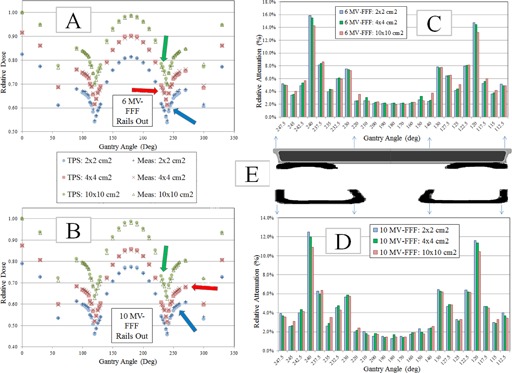
Chamber measurement and TPS calculated dose data for ‘Rails Out’ configuration. All charge readings were converted to dose using the AP field for the corresponding energy and field size. The doses were then normalized to the AP field for the corresponding energy. Arrows represent the maximum deviation for the corresponding field size. Comparison of TPS calculated and measured doses for 6 MV FFF (a) and for 10 MV FFF, for three field sizes. Measured relative attenuation values (c) for 6 MV FFF (the attenuation was calculated using the opposed gantry angle (180° of separation) that was not transmitted through the couch) and (d) 10 MV FFF for the three field sizes. Schematic (e) of couch showing the couch top and rails. The couch components have been scaled laterally to indicate the presence of a given couch component in the attenuation charts. The arrows indicate that the dimensions of the schematic apply to both the 6 MV FFF chart (above the schematic) and 10 MV FFF chart (below the schematic).