Figure 5.

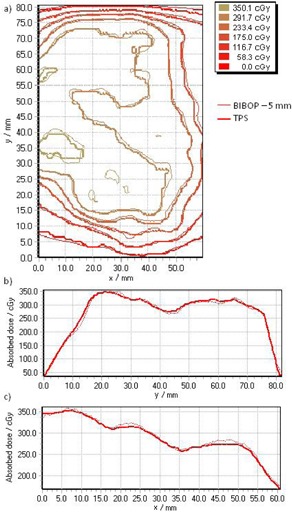
Typical example of a film comparision with the treatment planning system. The dose isolines (a) measured and calculated by the TPS for Plan 4 are shown with their Y (b) and X profiles (c) on the central axis.

Typical example of a film comparision with the treatment planning system. The dose isolines (a) measured and calculated by the TPS for Plan 4 are shown with their Y (b) and X profiles (c) on the central axis.