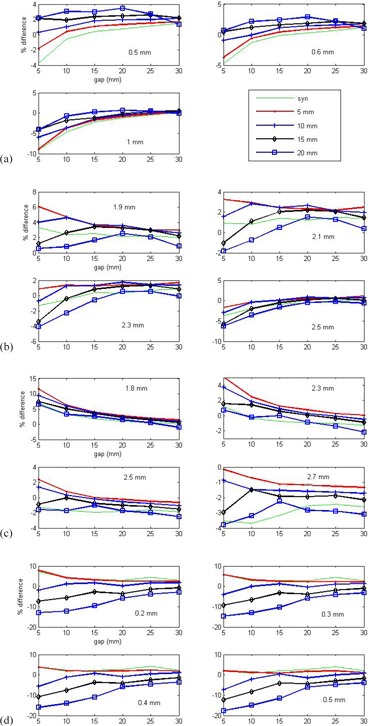
Figure 2.

Percentage difference between measured and calculated doses of the test fields. The values of DLG used in the calculation are noted in the figure. The legend of curves gives the T&G extensions in the test fields, where “syn” is for synchronized MLC motion (i.e., no extension). A linac‐specific optimal DLG was selected as that with the minimal discrepancy in the investigated region of gaps and T&G extensions: (a) HD 120 MLC in TrueBEAM STx, (b) millennium 120 MLC in Trilogy, (c) millennium 120 MLC in Clinac 21 EX, and (d) Siemens 160 MLC in Artiste. The sliding window technique was used in (a)–(c), and the step‐and‐shoot technique was used in (d).
