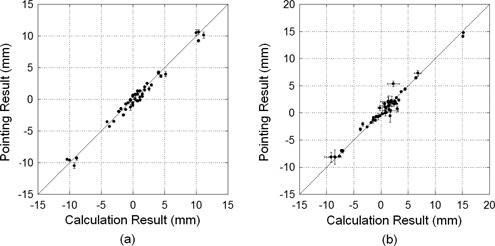
Figure 5.

Correlation graph between the calculation and pointing results for the phantom images (a) and for the images of the prostate cancer patient before positioning (b). The error bars in the Y direction are standard deviations of the pointing results for the three radiology technicians, and the error bars in the X direction are standard deviations of the calculation results for each image, where the image magnifications and image center positions were decided by each technician.
