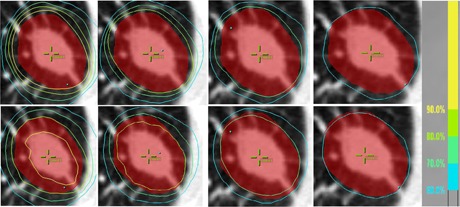
Figure 1.

Axial dose distributions for a representative patient (Patient 5), with plans normalized to 90%, 80%, 70%, and 60% prescription lines from left to right, respectively. The red color wash illustrates the PTV. The top panels utilize PB calculations, and bottom panels the MC calculations. Isodose lines higher than the prescription line are not shown for clarity. Despite the different prescription line selections, all four original PB plans show similar coverage and conformity by their individual prescription lines. However, the coverage loss on MC‐calculated plans is apparent for the 90% plan, but becomes increasingly better for decreasing isodose line plans. The MC coverage loss on the 60% plan is almost minimal.
