Figure 5.

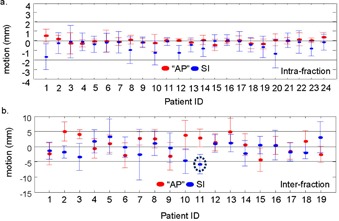
Mean and standard deviations of intrafraction (a) and interfraction (b) motions calculated from all image registrations for each individual patient.

Mean and standard deviations of intrafraction (a) and interfraction (b) motions calculated from all image registrations for each individual patient.