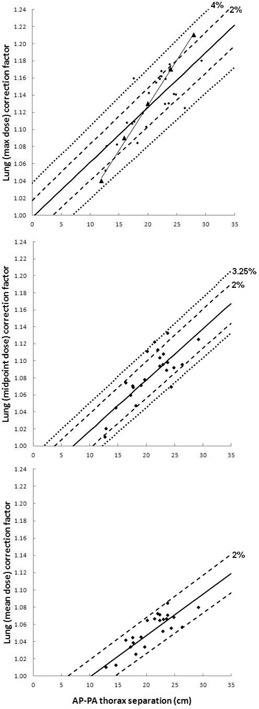
Figure 1.

6 MV AP–PA TBI lung dose correction factors. 6 MV AP‐PA thorax separation vs. lung correction factor, with linear fit, as calculated using lung maximum dose (top), lung midpoint dose (middle), and lung mean dose (bottom) for all 24 patients. Dashed trendlines indicate from the linear fit, as well as the percent error (i.e., ) for which 95% of the data points are included. Allowing x to represent AP–PA separation and y to represent lung dose correction factor, the linear trendlines are described as follows: (top) , (middle) , and (bottom) Triangular markers (with line for visualization purposes) indicate correction factors for 6 MV from Table 6 in TG‐29. (2)
