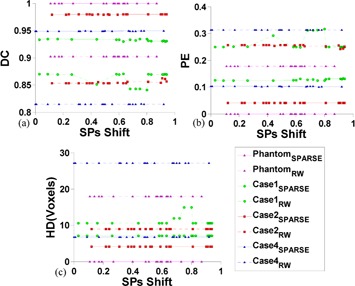
Figure 6.

Sensitivity analysis of SPs' location using the synthetic phantom and cases 1, 2 and 4. DC (a), PE (b), and HD (c) are comparisons of the segmentation response to random SPs location between RW and SPARSE, respectively. Given certain initial labeled SPs, the shift amplitude of each SPs is given by multiplying the minimum distance from its current location to the boundary points on the ground truth segmentation with a random number ranges in (0,1), which is the x‐axis. The shift direction is randomly assigned.
