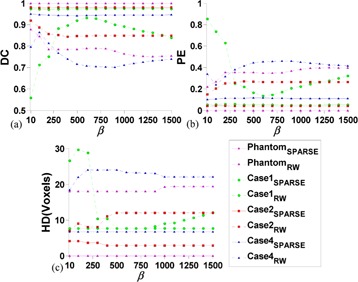
Figure 7.

Sensitivity analysis of β using the synthetic phantom and case 1, 2 and 4. DC (a), PE (b), and HD (c) are comparisons of the segmentation response to different β (with same SPs) between RW and SPARSE, respectively. β increases from 10 to 1500 with interval size of 100.
