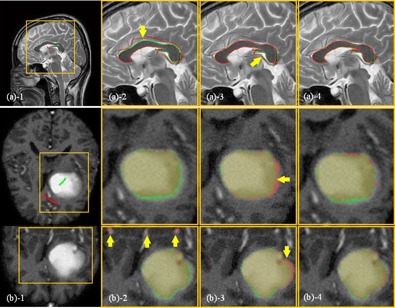
Figure 9.

Segmentation of homogenous targets: (a) the corpus callosum in a T2 MR image (case 3) and (b) the glioma in a T1c MR image (case 7). The ROIs, which are indicated by the yellow boxes, are shown in the zoomed‐in views for clarity. (a) SPs labeled inside (green) and outside (red) of the corpus callosum; (a) segmentation by RW; (a) segmentation by GC; (a) segmentation by SPARSE. The red and green curves in (a) represent the calculated and ground truth segmentations, respectively. The yellow arrow in (a) indicates the oversegmentation; (b) segmentation of a glioma in a T1c MR image (case 7): (b) SPs labeled inside (green) and outside (red) of the brain glioma on only one transversal slice; (b) segmentation by RW; (b) segmentation by GC; (b) segmentation by SPARSE. Upper and lower rows in (b) are the transversal and coronal slices, respectively. The red and green masks in (b) represent the calculated and ground truth segmentation; the yellow arrows in (b) indicate the oversegmentation.
