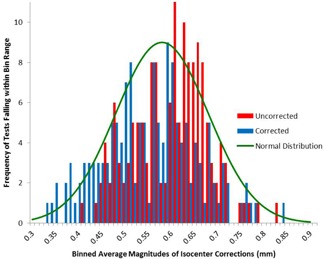
Figure 1.

Histogram with and without setup error. The blue curve is a representation of binning test results of daily positioning setup unbiased data, while the red curve is a histogram of the data without the correction applied to remove daily positioning error.
