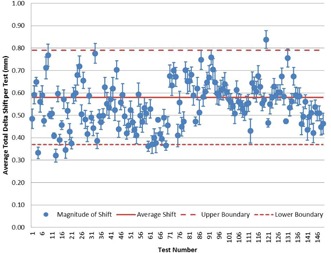
Figure 2.

Data points with error bars of 2 SDs. Average total magnitude of shift required to correct for the incongruency of isocenter of the phantom center and radiation field for each test with the daily setup error removed from the data. Each data point is displayed with standard error calculated from each of the 14 measurements used to calculate the mean. Additionally, for the dataset as a whole, the is displayed. Working under the assumption that the histograms approximate Gaussian behavior, it can be approximated that the error bars should encompass 95% of the data points.
