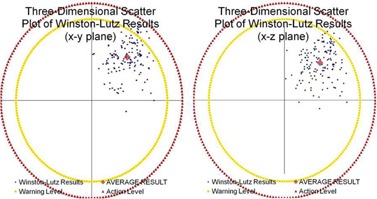
Figure 5.

3D plot. Two‐dimensions shown of a three‐dimensional scatter plot. The blue data points represent the isocenter as defined by the lasers during the test tool alignment for each of the considered 149 datasets. The vector directions were defined as positive , positive , and positive . The origin of this plot was the actual radiation isocenter. The red data point represents the average measured value of magnitude of noncongruency between the isocenters seen from the center of the test tool to the center of the radiation field. The outer circular perimeters represent a 1.25 mm warning level and a 1.50 mm action level.
