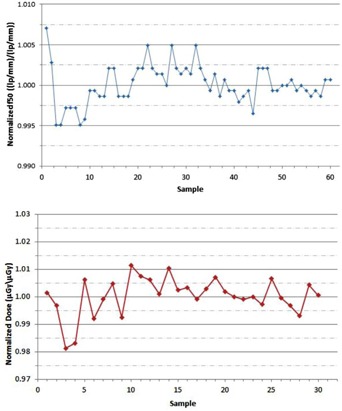
Figure 5.

The run chart of the normalized values (top) measured with the QCkV‐1 phantom and PIPSpro software is shown for the kV planar radiographic mode of the Varian OBI. The run chart of the normalized image dose values (bottom) measured with the Unfors RaySafe Xi R/F detector is shown for the kV planar radiographic mode of the Varian OBI.
