Figure 7.

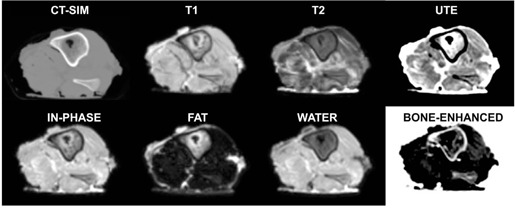
Axial CT‐SIM and 1.0T MR‐SIM images for a porcine shank, including ultrashort echotime (UTE), water and fat images generated via Dixon acquistions, and a bone‐enhanced image derived from the in‐phase and UTE datasets.

Axial CT‐SIM and 1.0T MR‐SIM images for a porcine shank, including ultrashort echotime (UTE), water and fat images generated via Dixon acquistions, and a bone‐enhanced image derived from the in‐phase and UTE datasets.