Figure 9.

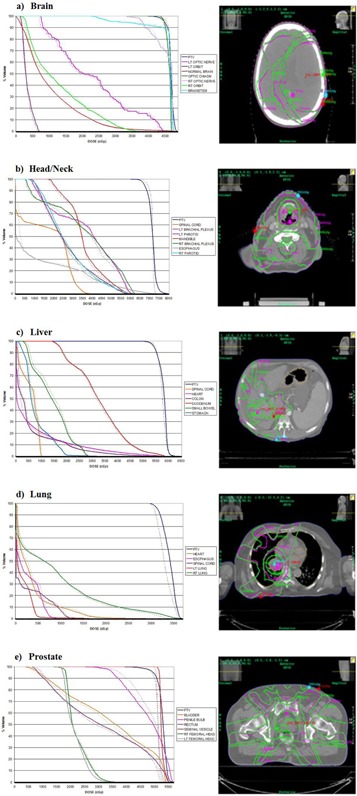
DVH and isodose lines in the reference data from TPS (green) can be compared with those calculated by the Dosimetry Check system (magenta) for: (a) brain, (b) head and neck, (c) liver, (d) lung, and (e) prostate treatment plans.

DVH and isodose lines in the reference data from TPS (green) can be compared with those calculated by the Dosimetry Check system (magenta) for: (a) brain, (b) head and neck, (c) liver, (d) lung, and (e) prostate treatment plans.