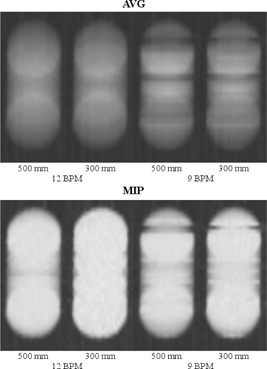
Figure 6.

Coronal cross sections from the second phantom study. In (a), the cross sections from the time‐averaged (AVG) reconstructions are shown for different respiratory frequencies (BPM). In (b), those of the maximum intensity projection (MIP) reconstructions are shown. All images were captured with our clinical window level of −402 HU and window width of −987 HU.
