
Figure 7.
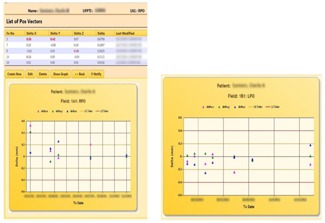
Table showing the correction vectors between the pre‐ and post‐treatment DIPS for the 1A1 field. Values exceeding the tolerances are highlighted and user is prompted to take actions. The “Show Graph” button presents a graphical analysis of the treatment records. A similar analysis for the 1B1 field is also shown.