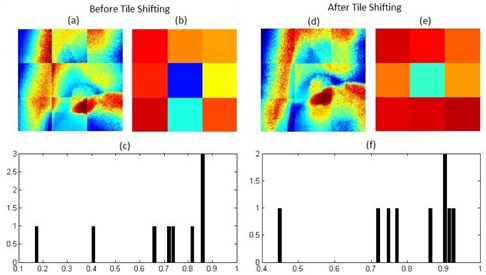
Figure 6.

(a) Tiled kV projection before tile‐shifting; (b) R2 image of tiles before shifting; (c) R2 plot on initial kV projection and corresponding DRR tiles. Similarly, (d),(e), and (f) show the tiled shifted kV projection, R2 image, and plot of tiles on kV projection and corresponding DRR tiles. The image tiles are not continuous because every tile has been normalized individually also for the purpose of presenting tiling configuration.
