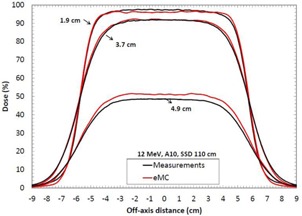
Figure 6.

Measured and calculated crossbeam profiles in water at different depths (1.9 cm, 3.7 cm, and 4.9 cm) for a field size at 12 MeV and . Measurements were performed with an ionization chamber. All beam profiles were normalized according to the measured and calculated depth‐dose curve.
