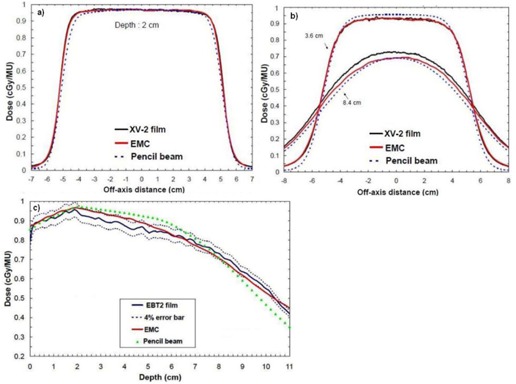
Figure 9.

Crossbeam profiles in the first version of the lung phantom and a depth‐dose curve in the second version of the lung phantom (12 MeV, , ): (a) profile at the plastic water–cork interface (2 cm of depth); (b) profiles in the cork at different depths (3.6 cm and 8.4 cm); (c) depth‐dose curve (0–2 cm water, 2–11 cm cork).
