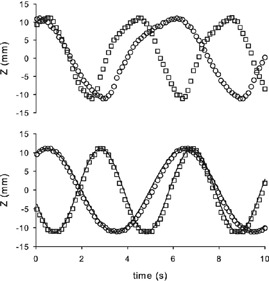
Figure 6.

Amplitude of the motion of Anzai phantom in z‐ (vertical) axis, for frequencies 10 rpm (○) and 15 rpm (□), and for quasi‐respiratory (up) and sinusoidal (down) modes. Only one of each three points is represented. Lines are the fitting of the data.
