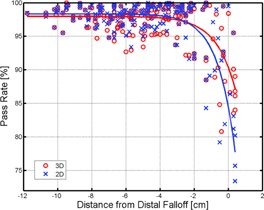
Figure 3.

Gamma dose comparison for SFO proton fields. Proton beams from patient‐specific SFO plans are measured. Gamma passing rates, both 3D (red ‘o’) and 2D (blue ‘x’), are recorded and plotted against the distance to the most distal layer (i.e., measurement depth subtracted by the range of the beam's deepest layer). Least square fits to the 3D (red solid line) and 2D (blue solid line) data are also shown.
