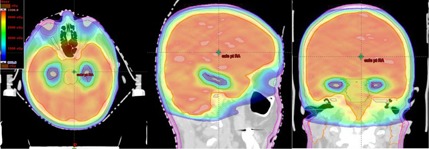
Figure 3.

Spatial dose distributions in axial, sagittal, and coronal views for one representative hippocampal‐sparing WBRT patient (Patient # III) using IMAT treatment planning. Red contoured region represents the hippocampus. Light‐blue contour represents the HAZ. Blue isodose colorwash represents 9 Gy; light blue, 15 Gy; light green, 25 Gy; red, 30 Gy; orange, 33 Gy, in 10 fractions. Other normal tissues structures such as parotid glands (orange contour), skin (pink contour), and brain stem (green contour) are clearly shown.
