Figure 1.

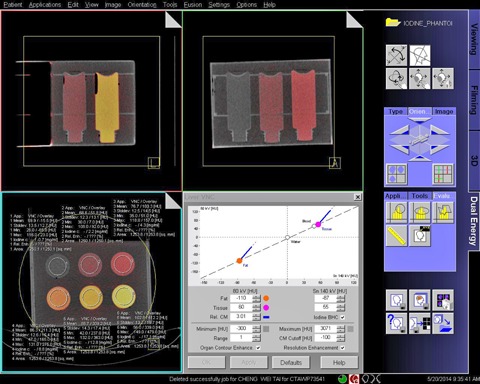
Screenshot of the Liver VNC application used for quantifying the iodine concentration. Images in the panel are fusion images of color‐coded iodine images and gray‐scale virtual noncontrast images.

Screenshot of the Liver VNC application used for quantifying the iodine concentration. Images in the panel are fusion images of color‐coded iodine images and gray‐scale virtual noncontrast images.