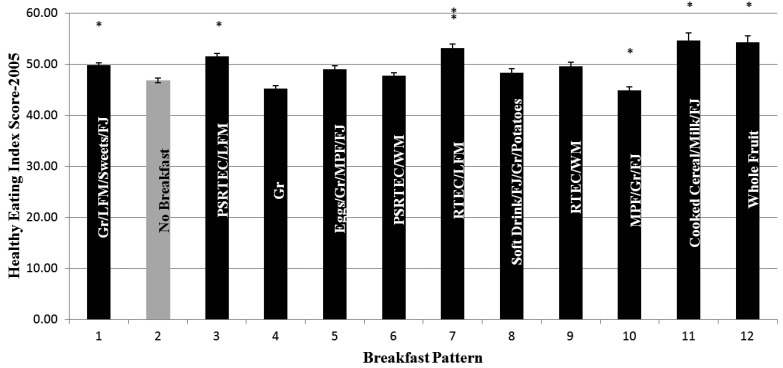
Figure 1. Healthy Eating Indices by Breakfast Cluster for children 2–18 years of age participating in the 2001-2008 National Health and Nutrition Examination Survey. Asterisk means that values are significantly different from No Breakfast (Pattern 2)—Bonferroni corrected p = 0.0042.
Breakfast Patterns: 1 = Grain/Lower Fat Milk/Sweets/Fruit Juice (FJ); 2 = No Breakfast; 3 = Pre-sweetened ready-to-eat cereal (PSRTEC)/Lower Fat Milk; 4 = Grains; 5 = Eggs/Grain/Meat, Poultry, Fish (MPF); 6 = PSRTEC/Whole Milk; 7 = RTEC/Lower Fat Milk; 8 = Soft Drinks/FJ/Grain/Potatoes; 9 = RTEC/Whole Milk; 10 = MPF/Grain/FJ; 11 = Cooked Cereal/Milk/FJ; 12 = Whole Fruit.Covariates: Age, gender, race/ethnicity, poverty income ratio grouped into three categories as (<1.25, 1.25–3.49, and >3.49), current smoking status (yes/no) (adults only), physical activity level (sedentary, moderate and vigorous), alcohol intake (g/d). Note that energy was not used as a covariate since the HEI score itself is controlled for energy.
Abbreviations: Gr= Grain; LFM = lower fat milk; FJ = Fruit Juice; PSRTEC = presweetened ready-to-eat-cereal; MPF = meat, poultry, fish; WM = whole milk; RTEC = ready-to-eat cereal.
*Significantly different from no breakfast; Bonferroni corrected, p < 0.0042

