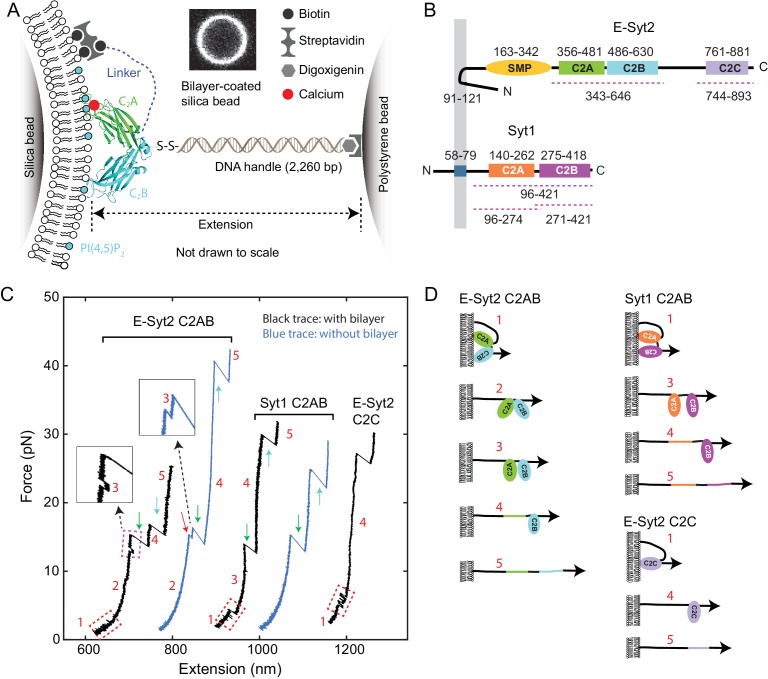
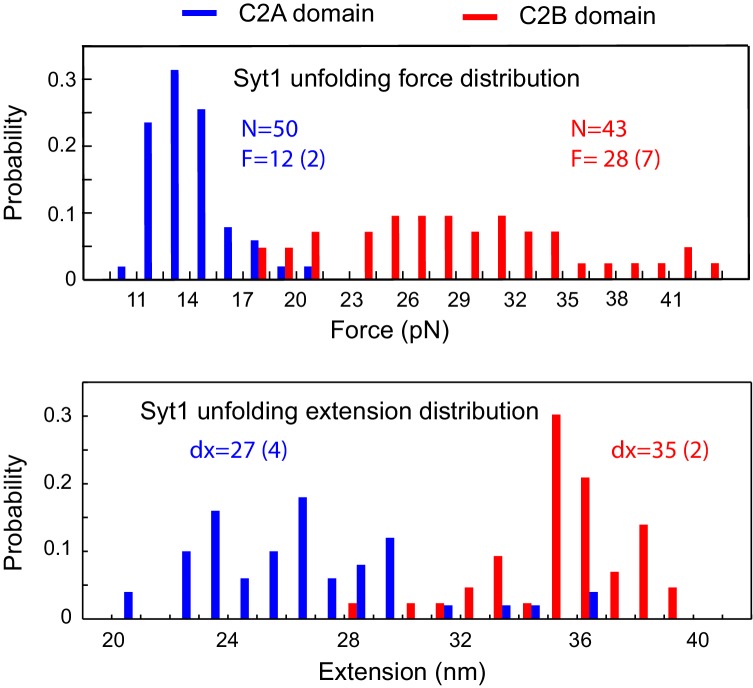
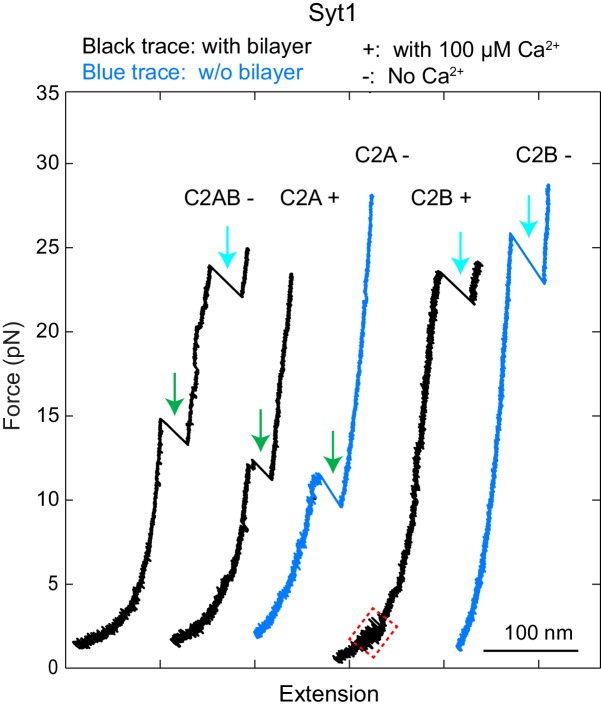
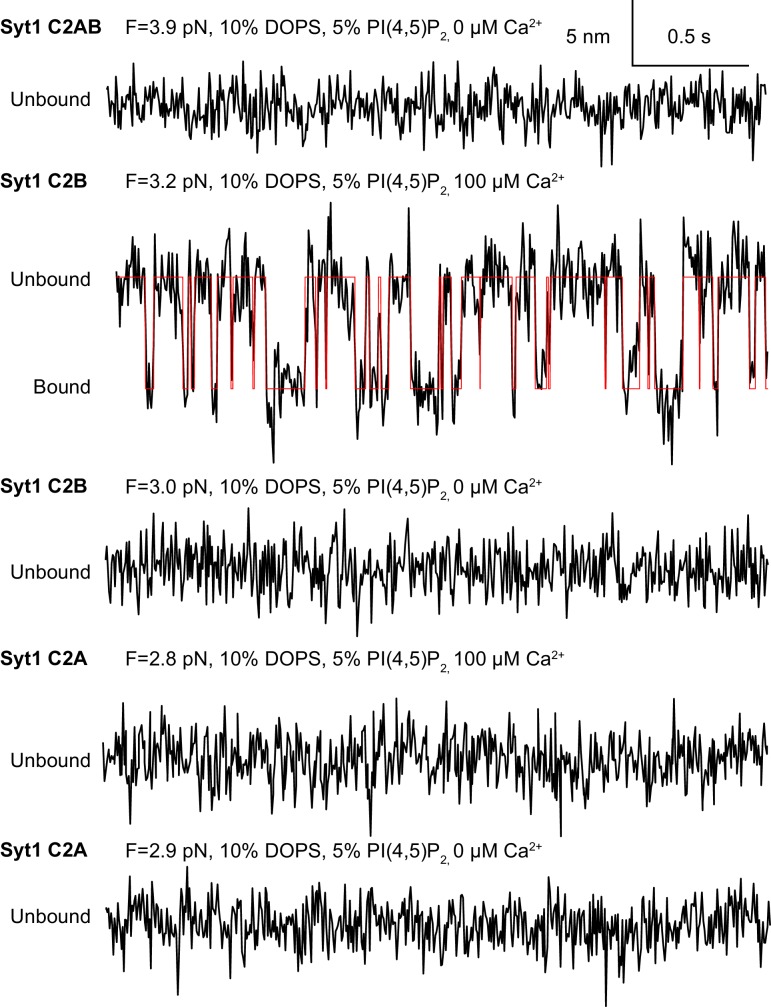
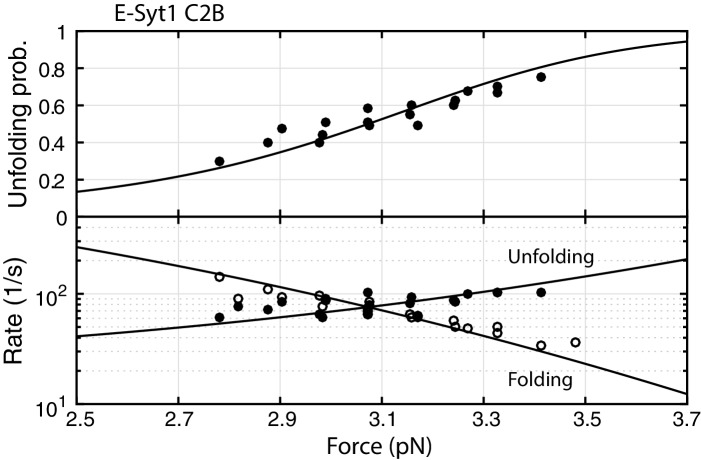
Figure 1. Experimental setup to study membrane binding and unfolding of C2 domains and interactions between C2 domains.
(A) Schematic diagram of the experimental setup to pull a single C2 domain (E-Syt2 C2AB shown) anchored on a lipid bilayer supported on a silica bead. The inset shows the fluorescence image of the bilayer on a silica bead of 5 µm in diameter. (B) Domain diagrams of Syt1 and E-Syt2. The dashed lines mark the truncated domains used in this study. (C) Force-extension curves (FECs) obtained by pulling C2 domains in the presence of supported bilayers (black) or in its absence (blue). Red-dashed rectangles mark reversible membrane binding and unbinding, while the cyan dashed rectangle indicates reversible C2AB association and dissociation. Green and cyan arrows mark unfolding of C2A and C2B domains, respectively. The insets show the transient state 3. Throughout the text, the FECs were mean-filtered to 100 Hz and shown. The E-Syt2 C2AB was pulled in the presence of membranes composed of 75% POPC, 20% DOPS, 5% PI(4,5)P2, and 0.03% biotin-PEG-DSPE. E-Syt2 C2C and Syt1 C2AB were tested on membranes with a similar composition, except for a decrease in DOPS to 10% and a corresponding increase in POPC to 85%. The solution contained 25 mM HEPES (pH 7.4), 200 mM NaCl, and 100 µM Ca2+ for E-Syt2 C2AB and Syt1 C2AB or no Ca2+ for E-Syt2 C2C. (D) Diagram of different C2 domain states derived from the FECs: 1, membrane-bound state; 2, unbound state with two associated C2 domains; 3, unbound state with two dissociated C2 domains; 4, state with a single folded C2 domain; 5, fully unfolded state.

