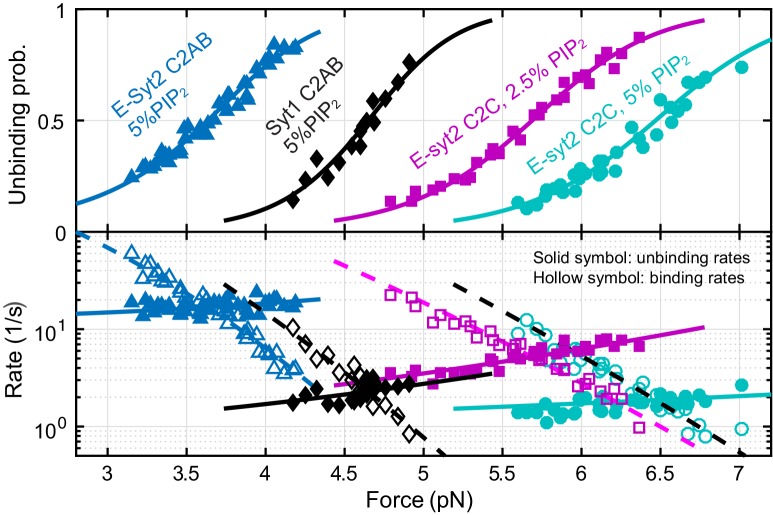
Figure 3. Force-dependent unbinding probabilities (top) and transition rates (bottom) and their best model fits (solid and dashed curves) reveal the energy and kinetics of C2 binding at zero force (Table 1).
Unbinding probabilities and rates are indicated by solid symbols, while binding rates are shown by hollow symbols.
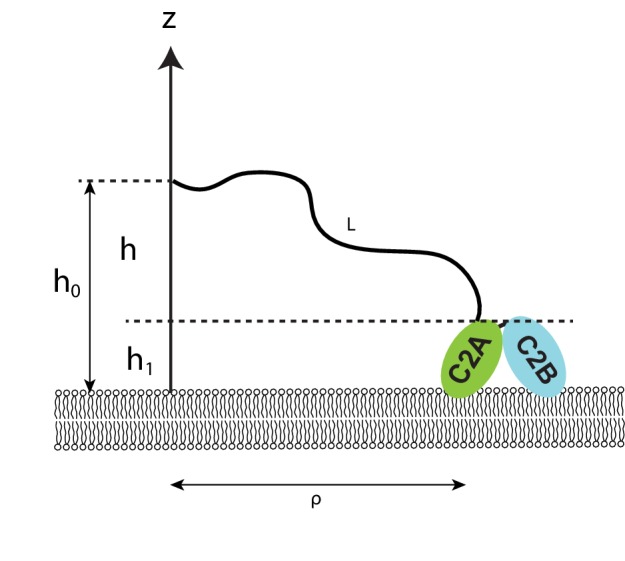
Figure 3—figure supplement 1. Diagram illustrating the effect of membrane tethering on protein binding to the membrane.


