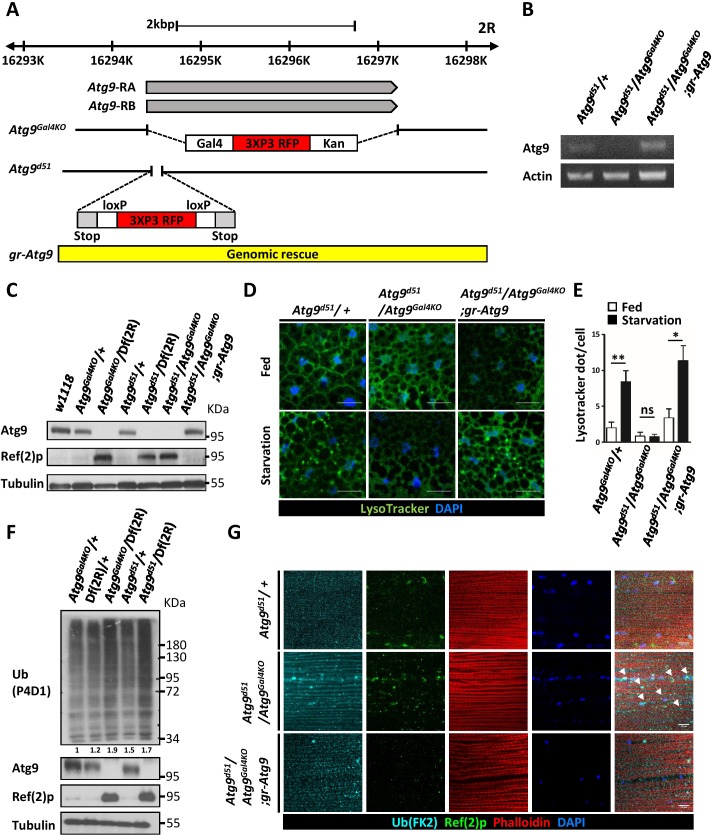
Figure 1. Generation of mutations in Drosophila Atg9.
(A) Schematic view of Atg9Gal4KO and Atg9d51mutations relative to the Atg9 transcripts. For the Atg9Gal4KO mutation, the complete Atg9 open reading frame was replaced with a Gal4 knock-in cassette. For Atg9d51 mutation, the 52–102 bp after the Atg9 start codon was replaced with the attPX-3-frameStop-floxed 3xP3-RFP cassette. (B) RT-PCR analysis of Atg9 mRNA expression level in control, mutant and Atg9 genomic rescue adult flies. Atg9 mRNA levels were undetectable in the Atg9 mutant. (C) Western blots show the endogenous Atg9 protein in control and Atg9 genomic rescue flies but fail to detect the protein in mutants. (D) LysoTracker Green staining reveals that starvation-induced autophagy is strongly reduced in Atg9 mutant fat bodies, compared with controls. Scale bar: 5 μm. (E) Quantification of data shown in (D). n ≥ 10, data are mean ±s.e.m. *p<0.05, **p<0.01. ns, not statistically significant. (F) Western blots show markedly increased Ref(2)P and ubiquitinated protein levels in Atg9 mutants. (G) Immunostaining of Drosophila thoracic muscles with anti-Ub (FK2) and anti-Ref(2)p antibodies showed an accumulation and colocalization of polyubiquitin protein aggregates and Ref(2)p (arrowheads) in Atg9 mutant flies. Scale bar: 10 μm. Df refers to Df(2R)Exel7142, which removes Atg9 and flanking genes.


