. 2017 Nov 16;6:e29338. doi: 10.7554/eLife.29338

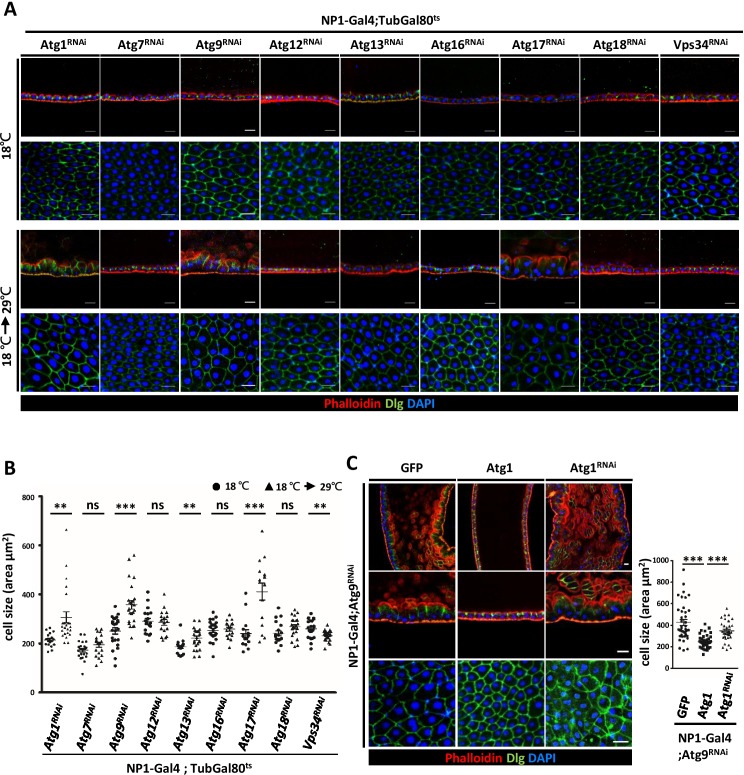
Figure 5. Components of Atg1 kinase complex are required for adult midgut epithelium homeostasis.

(A) Systematic knock-down of Drosophila Atg1, Atg7, Atg9, Atg12, Atg13, Atg16, Atg17, Atg18 and Vps34 in adult midgut with the EC-specific driver NP1-Gal4; Gal80ts. The flies were either kept at 18°C throughout development or shifted to 29°C after eclosion for 5 days to inactivate Gal80ts and enable expression of the RNAi targeting Atg genes. Ablation of Atg1, Atg13, and Atg17, but not other Atg genes, caused increased cell size. (B) Quantification of posterior midgut cell size (shown in A) of Atg depleted flies. n ≥ 15, data are mean ±s.e.m. **p<0.01, ***p<0.001. ns, not statistically significant. (C) Overexpression of Atg1 suppressed Atg9RNAi-induced adult midgut defects. n ≥ 30, ***p<0.001. Scale bar: 20 μm.

Figure 5—source data 1. Quantification of cell size.
DOI: 10.7554/eLife.29338.019

Figure 5.

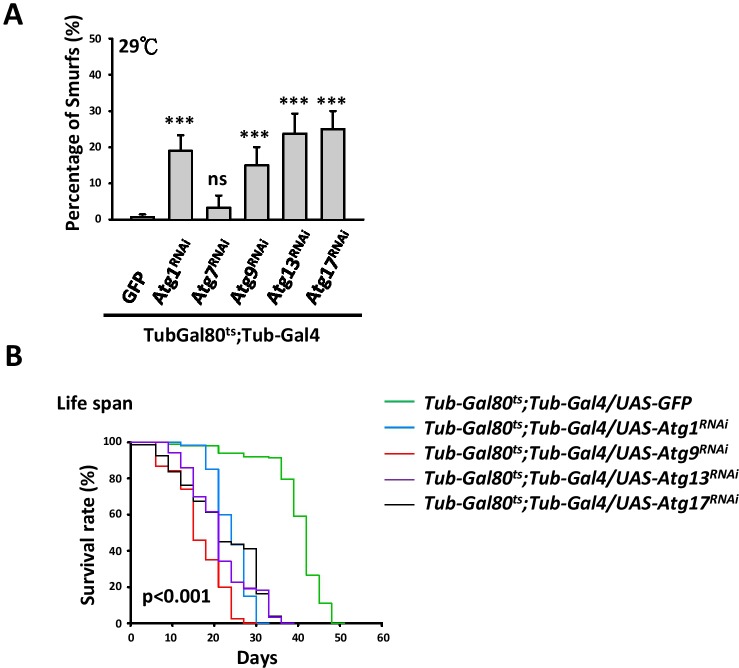
Figure 5—figure supplement 1. Depletion of Atg1, Atg13, or Atg17 in adult fly causes intestinal barrier dysfunction and shortened lifespan.

Figure 5—figure supplement 1.

(A) Quantification of Smurf flies showing that temporal knockdown of Atg1, Atg9, Atg13 and Atg17 resulted in intestinal barrier dysfunction in 30-day-old flies, compared with controls. n ≥ 40, data are mean ±s.e.m., ***p<0.001. (B) Temporal knockdown of Atg1, Atg9, Atg13 and Atg17 with Gal80ts; Tub-Gal4 led to shortened lifespan, compared with the control (Long-rank test, p<0.001).
Figure 5—figure supplement 1—source data 1. Survival rate and percentage of Smurfs.
DOI: 10.7554/eLife.29338.020
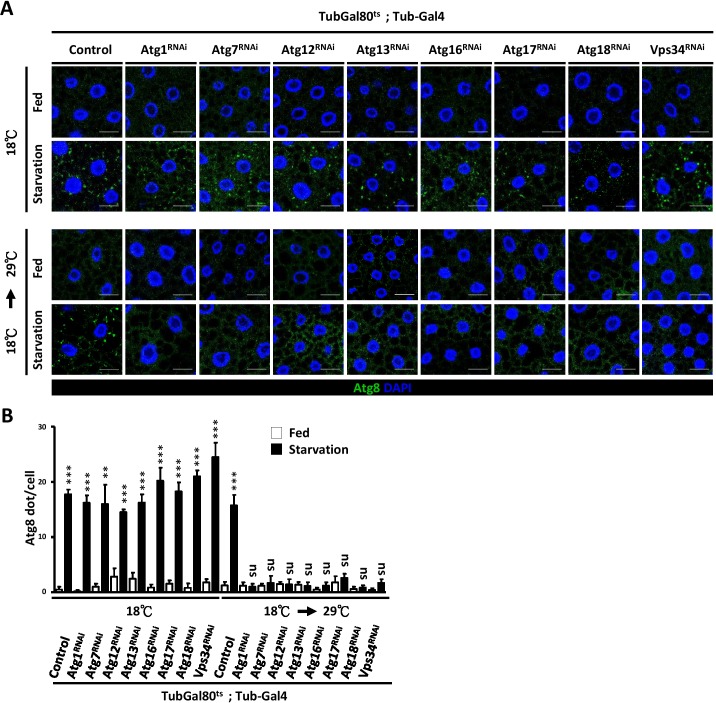
Figure 5—figure supplement 2. Temporal knockdown of Atg genes impairs autophagy.

Figure 5—figure supplement 2.

(A) Temporal control of Atg genes RNAi expression using the Tub-Gal80ts; Tub-Ga4 inducible system. The flies were either maintained at 18°C throughout development or shifted to 29°C 1 day after egg laying for inactivate Gal80ts and enable expression of the RNAi. The larval fat bodies from well fed or starved animals were stained with DAPI (blue) and anti-Atg8 antibody. Scale bar: 20 µm. (B) Quantification of Atg8-positive dots of denoted genotypes. n ≥ 4, data are mean ±s.e.m., ***p<0.001. ns, not statistically significant.
Figure 5—figure supplement 2—source data 1. Quantification of Atg8 dots.
DOI: 10.7554/eLife.29338.021