. 2017 Nov 16;6:e29338. doi: 10.7554/eLife.29338

Figure 6. Loss of Atg9 enhances TOR activity in Drosophila adult midgut.

(A) The adult midguts of denoted genotypes were dissected, lysed, and subjected to Western blot analysis with anti-Atg9, anti-Ref(2)P, anti-p-S6K, anti-p-4EBP and anti-tubulin antibodies. (B) Inhibition of TOR activity by feeding flies with rapamycin rescued Atg9 mutant midgut defects. (C) Quantification of posterior midgut cell size shown in (B). n ≥ 17, data are mean ±s.e.m. ***p<0.001. (D–K) Atg9 genetically interacts with components of the TOR signaling pathway. The Atg9RNAi-induced midgut defects (D) could be suppressed by the coexpression of TSC1-TSC2 (E), RhebRNAi (F), dominant-negative TOR (TORTED) (G), or dominant-negative S6K (S6KKQ) (H), whereas coexpression of TOR activator Rheb (I) or knock-down of TSC1 (J) or TSC2 (K) could not rescue the Atg9RNAi-induced midgut defects. Genetic analyses were performed for three times with 100% penetrance of the phenotype. (L) Quantification of posterior midgut cell size shown in (D–K). n ≥ 18, data are mean ±s.e.m. ***p<0.001. ns, not statistically significant. Scale bar: 20 μm.

Figure 6—source data 1. Quantification of cell size.
DOI: 10.7554/eLife.29338.025

Figure 6.

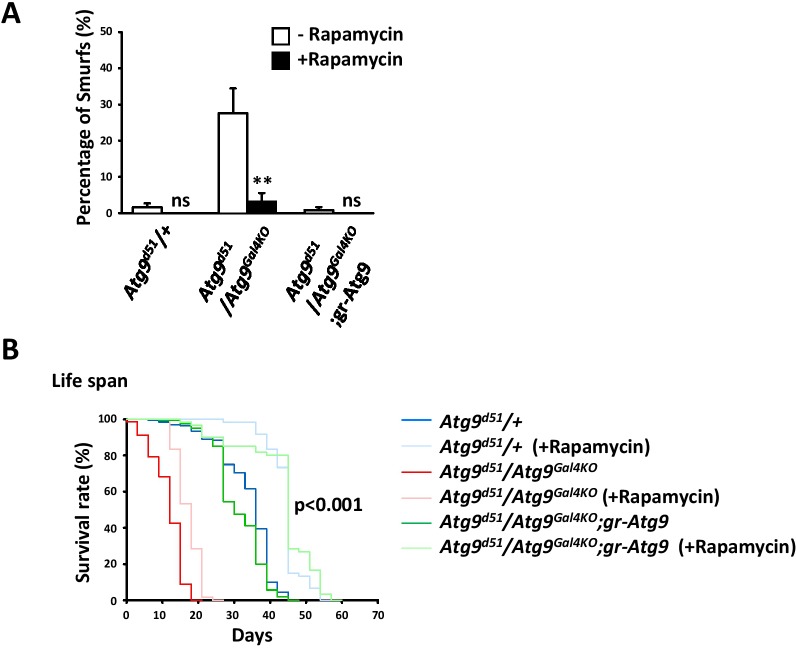
Figure 6—figure supplement 1. Rapamycin treatment rescues the intestinal barrier dysfunction of Atg9 mutants.

Figure 6—figure supplement 1.

(A) Quantification of Smurf flies showing that rapamycin treatment significantly decreased the number of Smurf-positive flies in aged Atg9 mutants. n ≥ 120, data are mean ±s.e.m., **p<0.01. ns, not statistically significant. (B) Inhibition of TOR activity by feeding flies with rapamycin could not rescue the short lifespan of Atg9 mutants, compared with controls. (Long-rank test, p<0.001).
Figure 6—figure supplement 1—source data 1. Survival rate and percentage of Smurfs.
DOI: 10.7554/eLife.29338.026
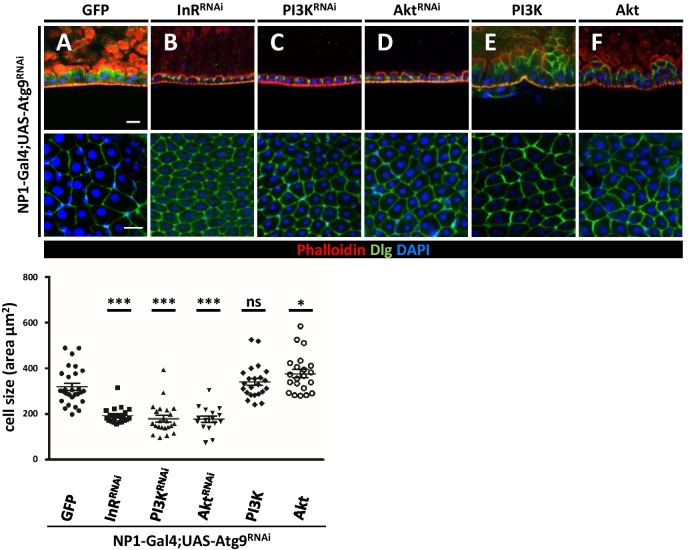
Figure 6—figure supplement 2. Atg9 genetically interacts with components of the insulin receptor/phosphoinositide 3-kinase (InR/PI3K) signaling pathway.

Figure 6—figure supplement 2.

The Atg9RNAi-induced midgut defects (A) could be suppressed by the coexpression of InRRNAi (B), PI3KRNAi (C), or AktRNAi (D), whereas coexpression of PI3K (E) or Akt (F) dramatically enhanced Atg9RNAi-induced midgut defect. Genetic analyses were performed for three times with 100% penetrance of the phenotype. The cell size of posterior midgut ECs of each genotype was quantified. n ≥ 16, data are mean ±s.e.m. ***p<0.001, *p<0.05. ns, not statistically significant. Scale bar: 20 μm.
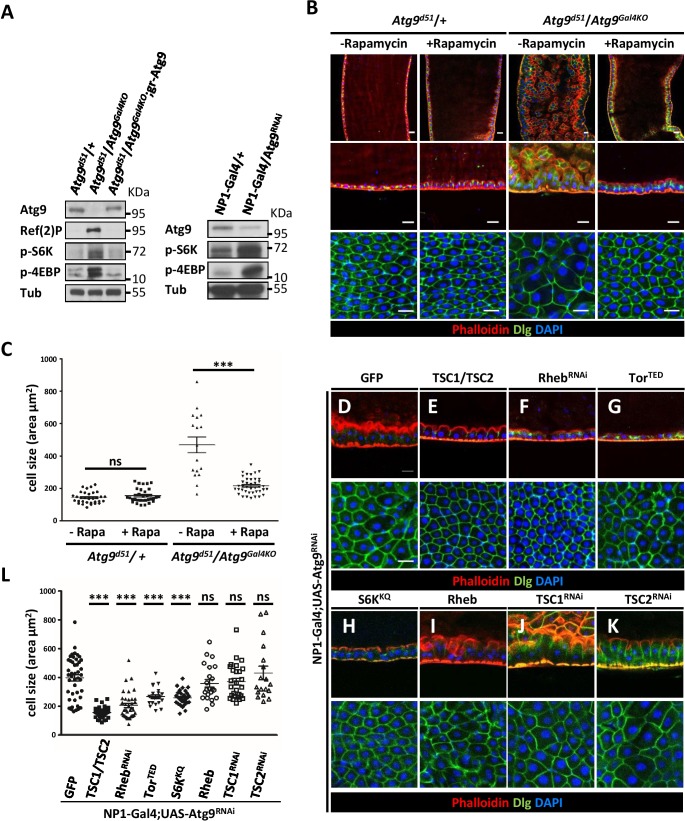
Figure 6—figure supplement 2—source data 1. Quantification of cell size.
DOI: 10.7554/eLife.29338.027